
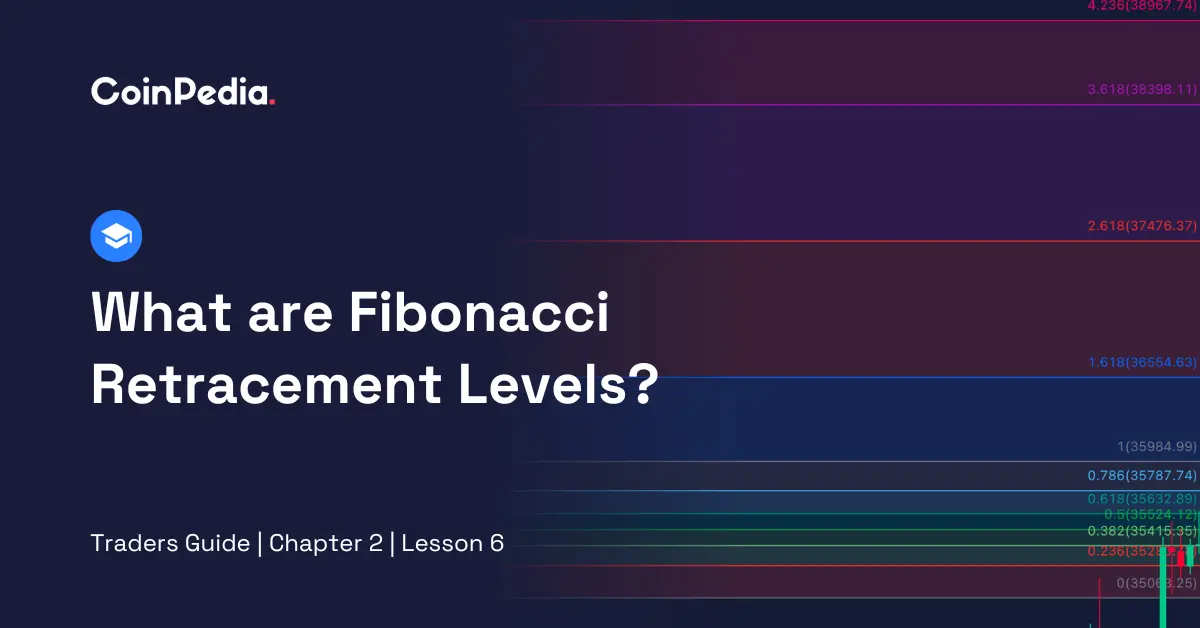
If you’ve been trading for a while, you’ve probably seen price levels where the market just seems to “bounce” or “reverse” as if there’s some invisible force holding it. Well, it turns out there’s some math behind it. One of the most popular tools traders use to find these levels is called Fibonacci retracement levels.
You don’t need to be a math genius to use them. In fact, once you understand how they work, they might become one of your go-to tools for spotting potential entry and exit points.
Let’s break it down, step by step.
What Are Fibonacci Retracement Levels?
Fibonacci retracement levels are key price levels based on the famous Fibonacci sequence. Traders use them to identify possible reversal points in a market trend. The idea is simple: when a price moves up or down, it doesn’t do so in a straight line. It pulls back before continuing its move. These pullbacks often stop at Fibonacci levels.
The main Fibonacci levels used in trading are:
- 23.6%
- 38.2%
- 50% (not technically Fibonacci, but widely used)
- 61.8%
- 78.6%
These percentages represent how much of the previous price move the market might retrace before continuing in the original direction.
Let’s say Bitcoin jumps from $30,000 to $40,000. A pullback to 38.2% would mean it drops to $36,180 before possibly continuing upward.
Traders use these levels to predict where price might reverse or continue moving.
The History Behind Fibonacci Retracement Levels
The Fibonacci sequence itself comes from a 13th-century mathematician named Leonardo Fibonacci. He discovered a pattern in nature where each number in the sequence is the sum of the two before it: 0, 1, 1, 2, 3, 5, 8, 13, 21…
But how does this relate to trading?
When you divide certain numbers in the sequence, you get ratios that appear everywhere in nature—from flower petals to galaxies. These same ratios are what traders use in the markets. The most important one is 61.8%, also called the “Golden Ratio.” It’s considered a key level where price often reverses.
Traders have used Fibonacci levels for decades to analyze price movements. From stocks to crypto, these levels keep showing up, making them an essential tool for technical analysis.
How to Calculate Fibonacci Retracement Levels
Now, let’s make this practical.
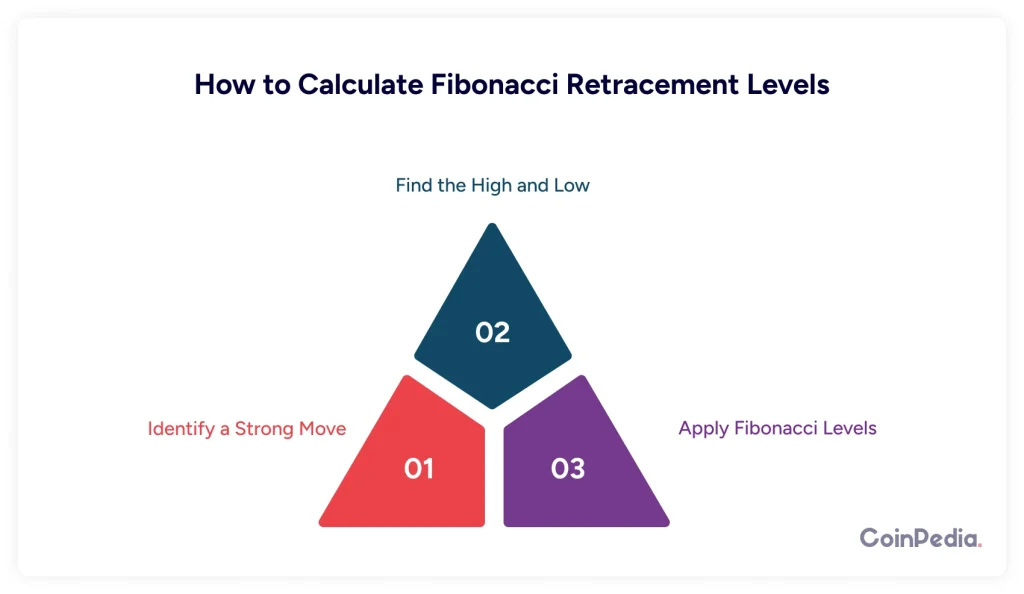
Step 1: Identify a Strong Move
Look for a strong uptrend or downtrend. This could be a big price jump or drop over a short period.
Step 2: Find the High and Low
If the price is rising, take the lowest point as your starting point and the highest as your ending point. If the price is falling, reverse it.
Step 3: Apply Fibonacci Levels
Most trading platforms have Fibonacci retracement tools. You simply plot the tool on the chart, and it will automatically show you the key levels.
For example, if Ethereum rises from $1,500 to $2,000, your Fibonacci levels will be:
- 23.6% retracement: $1,882
- 38.2% retracement: $1,809
- 50% retracement: $1,750
- 61.8% retracement: $1,691
If the price pulls back to one of these levels, traders look for signs that it might bounce back up.
Why Are Fibonacci Retracements Important?
So, why do traders rely on these levels? Here are a few key reasons:
1. Helps Spot Support and Resistance
Fibonacci levels often act as support (where price stops falling) or resistance (where price stops rising). If the price stalls at a Fibonacci level, it might be a sign that traders are reacting to it.
2. Works Well With Other Indicators
Fibonacci retracements are even more powerful when used with other tools like moving averages, trendlines, and RSI (Relative Strength Index). If a Fibonacci level lines up with another indicator, it strengthens the case for a trade.
3. Helps Plan Entry and Exit Points
Instead of guessing where to enter a trade, Fibonacci gives traders specific price levels to watch. If you’re in a trade, you can also use Fibonacci to set stop losses or profit targets.
4. It’s Used by Big Players
Fibonacci retracement levels are widely used by institutional traders. This means a lot of people are watching the same levels, which increases their importance.
Limitations of Using Fibonacci Retracement Levels
Fibonacci is not a magic tool. It has its flaws, and traders need to be aware of them.
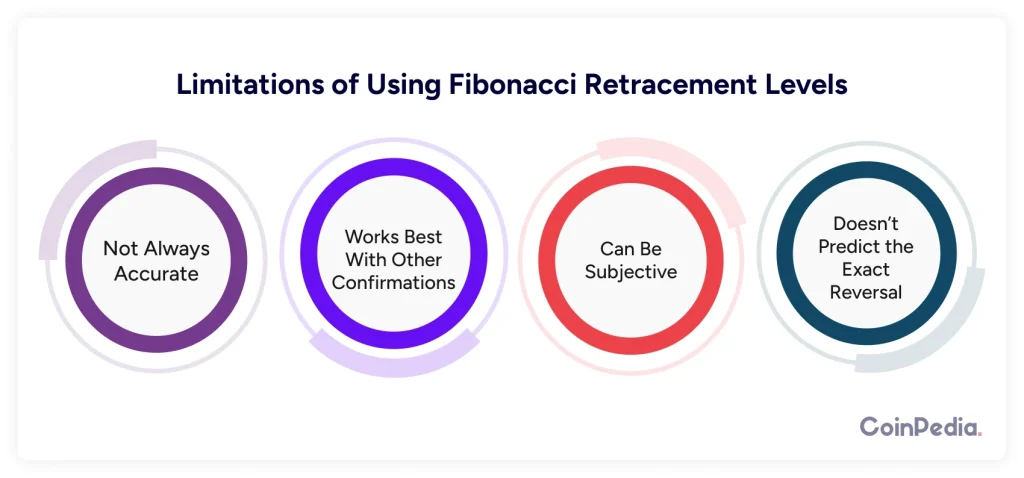
1. Not Always Accurate
Just because a price hits a Fibonacci level doesn’t mean it will bounce. Sometimes, price blows right through these levels, making them ineffective.
2. Works Best With Other Confirmations
Fibonacci retracements work best when used with other indicators. If you rely only on Fibonacci, you might find yourself entering trades at the wrong time.
3. Can Be Subjective
Different traders may plot Fibonacci levels differently, leading to different results. Some might use wicks (highs/lows), while others use body candles.
4. Doesn’t Predict the Exact Reversal
Fibonacci only suggests potential levels, but it doesn’t guarantee a reversal will happen. Price might slightly overshoot or undershoot these levels.
Example of Fibonacci in Action
Let’s say you’re trading Bitcoin and see it rising from $20,000 to $30,000. After hitting $30,000, the price starts pulling back. Instead of panicking, you apply Fibonacci retracement levels.
The 50% retracement level sits at $25,000, and the price starts to slow down there. Then, it reverses and begins moving back up.
This could be a great buying opportunity!
But let’s say the price crashes through 50% and reaches 61.8% at $24,000. If it bounces there, you might enter a trade with a stop loss below $24,000.
Final Thoughts
Fibonacci retracement levels are a powerful tool that can help traders identify key price levels, find potential trade entries, and set stop losses. While they’re not perfect, they work well when combined with other strategies.
Next time you see a strong price move, try plotting Fibonacci retracement levels. You might be surprised how often they align with market movements!
FAQs
Fibonacci retracement is a tool that identifies potential support and resistance levels based on key percentage retracements of a price move.
Plot Fibonacci from a swing high to low (or vice versa). Watch key levels (38.2%, 50%, 61.8%) for potential reversals or continuation signals.
No, but it helps traders identify potential reversal zones. It works best with other indicators like RSI, moving averages, and trendlines.
It depends on your trading style. Day traders use shorter timeframes (15m-1H), while swing traders prefer 4H, daily, or weekly charts.