

If you’ve ever stared at a trading chart, wondering how people spot trends before they happen, you’re not alone. The secret? Indicators. And one of the most powerful indicators out there is the MACD (Moving Average Convergence Divergence).
Imagine having a tool that helps you see momentum shifts before the market makes a move. That’s exactly what MACD does. It’s not magic—it’s just math, but it works like a charm when used correctly.
Let’s break it down in simple terms and see how you can use MACD to make smarter trades.
What Is MACD?
MACD is a momentum indicator that helps traders see when a trend is gaining or losing strength. It does this by comparing two moving averages of a stock or crypto’s price.
Think of it as a way to measure the speed of a car. The faster the car is moving (or the price trend is growing), the stronger the momentum. When the car slows down, it signals a possible change in direction.
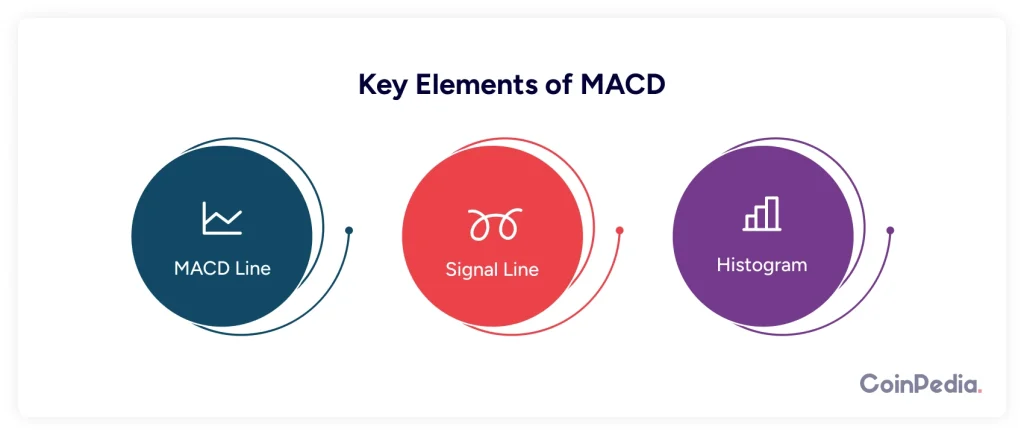
MACD Consists of Three Key Components:
- MACD Line – The difference between two moving averages (12-day and 26-day EMA).
- Signal Line – A 9-day moving average of the MACD line.
- Histogram – A visual representation of the difference between the MACD line and the Signal line.
When the MACD line crosses above the Signal line, it suggests a bullish (buy) signal. When it crosses below, it suggests a bearish (sell) signal.
How Do Traders Use Moving Average Convergence/Divergence (MACD)?
MACD is widely used in three main ways:
1. Identifying Trend Direction
MACD helps confirm if an asset is in an uptrend or a downtrend.
- If the MACD line is above zero, the trend is bullish.
- If the MACD line is below zero, the trend is bearish.
Example: Let’s say Bitcoin’s MACD is above zero and rising. This means momentum is strong, and the price may continue climbing.
2. Finding Entry and Exit Points
Traders look for crossovers between the MACD line and the Signal line to decide when to enter or exit a trade.
- Bullish crossover (MACD crosses above Signal line) = Buy Signal.
- Bearish crossover (MACD crosses below Signal line) = Sell Signal.
Example: If Apple’s MACD line crosses above its Signal line, it may be a good time to buy, expecting the price to rise.
3. Spotting Divergences
Divergence happens when the price is moving in one direction, but MACD is moving in another. This can be a warning sign that the trend is losing strength.
- Bullish Divergence: Price is making lower lows, but MACD is making higher lows = Possible price increase.
- Bearish Divergence: Price is making higher highs, but MACD is making lower highs = Possible price drop.
Example: If Tesla’s stock price is hitting new highs, but MACD is failing to reach new highs, it could be a signal that the uptrend is weakening.
What Are Some Strengths of MACD?
MACD is a favorite among traders for several reasons:
1. Simple Yet Powerful
Unlike some indicators that require deep technical knowledge, MACD is easy to understand. Even beginners can quickly learn to use it effectively.
2. Works Across Markets
Whether you’re trading stocks, crypto, forex, or commodities, MACD remains effective. It adapts well to different market conditions.
3. Helps Reduce Noise
Markets are noisy with random price movements. MACD smooths things out by focusing on meaningful momentum changes.
4. Great for Confirming Trends
MACD helps confirm whether a trend is truly strong or just a temporary movement. This prevents traders from making impulsive decisions.
What Are Some Limitations of MACD?
No indicator is perfect, and MACD has its drawbacks too.
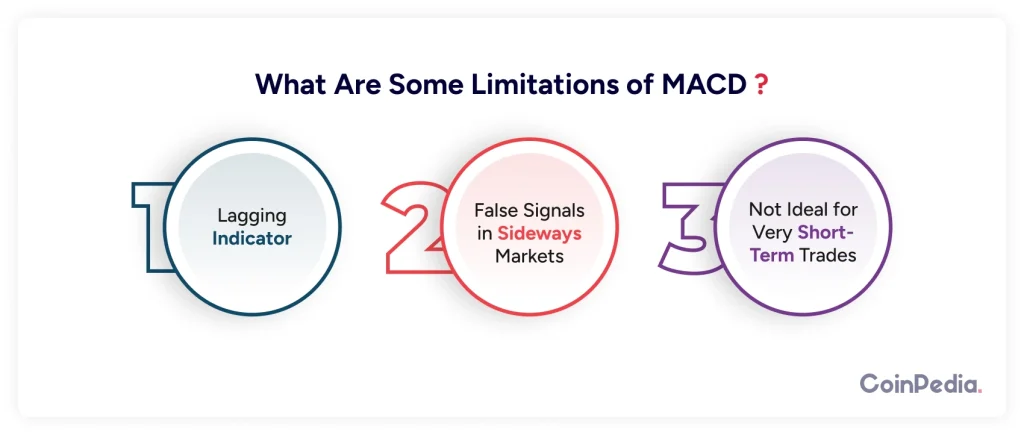
1. Lagging Indicator
MACD is based on moving averages, which means it reacts after the price has already moved. This can lead to delayed signals.
Example: You might get a buy signal after the price has already surged, causing you to enter late.
2. False Signals in Sideways Markets
MACD works best in trending markets. When the price is moving sideways, it can generate false buy or sell signals.
Example: If Ethereum is stuck between $3,000 and $3,100 for weeks, MACD crossovers might give misleading signals.
3. Not Ideal for Very Short-Term Trades
If you’re a day trader looking for ultra-fast moves, MACD may not be the best tool. Other indicators, like RSI or Bollinger Bands, might be better for quick trades.
How to Calculate MACD?
If you’re curious about how MACD is actually calculated, here’s the simple formula:
- Calculate the 12-day EMA (Exponential Moving Average) of the closing price.
- Calculate the 26-day EMA of the closing price.
- Subtract the 26-day EMA from the 12-day EMA to get the MACD Line.
- Calculate the 9-day EMA of the MACD Line to get the Signal Line.
- Subtract the Signal Line from the MACD Line to get the Histogram.
Most trading platforms calculate MACD automatically, so you don’t have to do the math manually. But understanding the process helps you trust the indicator more.
Final Thoughts: Should You Use MACD?
Absolutely! But like any tool, it’s not a magic bullet. MACD works best when combined with other indicators like RSI (Relative Strength Index) or support & resistance levels.
If you’re a beginner, start by using MACD to identify trends and crossovers. With practice, you’ll get better at spotting real opportunities and avoiding false signals.
So next time you open a trading chart, add MACD and see what it tells you. You might be surprised at how much clarity it brings to your decisions!
FAQs
MACD (Moving Average Convergence Divergence) is a momentum indicator that helps traders spot trend changes using moving averages and crossovers.
A bullish crossover (MACD above Signal line) suggests buying, while a bearish crossover (MACD below Signal line) signals selling. Histogram confirms strength.
The standard MACD settings (12, 26, 9) work well for most markets, but short-term traders may adjust to faster (5, 13, 6) settings for quicker signals.
MACD helps identify trend direction, entry/exit points, and momentum shifts by analyzing moving averages and crossovers for buy or sell signals.