

Key takeaways
- Chainlink could reach a maximum value of $15.65 in 2026.
- By 2029, LINK could reach a maximum price of $49.96.
- In 2032, Chainlink is expected to range between $120.12 and $151.35.
The Chainlink platform emerged as a prominent player in the cryptocurrency market. It provides a secure, decentralized oracle network that connects smart contracts with real-world data, influencing the current price. As the adoption of decentralized finance (DeFi) and blockchain technology continues to grow, Chainlink’s innovative solutions have attracted significant attention from investors and traditional financial institutions alike.
Chainlink continues to expand its reach and utility across the blockchain ecosystem, showcasing its robust integration capabilities and promoting enterprise adoption across various sectors through its cross-chain interoperability protocol. Recent updates highlight 14 new integrations of 5 Chainlink services across 10 different blockchain platforms, demonstrating its versatility across multiple blockchains, including prominent names like Arbitrum, Avalanche, and Ethereum. These integrations enhance Chainlink’s network and solidify its position as a critical player in the interoperability and functionality of decentralized applications.
Understanding Chainlink’s potential price movements based on the information presented is crucial for making an investment decision. It involves analyzing various factors, including market trends, technological advancements, partnerships, and overall market sentiment. This Chainlink price prediction aims to provide insights into its future performance by examining technical analysis and fundamental aspects that could influence its value.
Overview
| Cryptocurrency | Chainlink |
| Token | LINK |
| Price | $9.30 |
| Market Cap | $6.58B |
| Trading Volume (24-hour) | $595.76M |
| Circulating Supply | 708.09M LINK |
| All-time High | $52.88, May 09, 2021 |
| All-time Low | $0.1263, Sep 23, 2017 |
| 24-hour High | $9.53 |
| 24-hour Low | $8.19 |
Chainlink price prediction: Technical analysis
| Metric | Value |
| Price prediction | $10.95 (+16.26%) |
| Price Volatility (30-day variation) | 11.89% (Very High) |
| 50-day SMA | $10.86 |
| 14-day RSI | 34.08 (Neutral) |
| Sentiment | Bearish |
| Fear & Greed Index | 11 (Extreme Fear) |
| Green days | 11/30 (37%) |
| 200-day SMA | $14.60 |
Chainlink price analysis: LINK tests upper range as momentum builds across timeframes
- LINK trades at $9.24, down 0.32% but up nearly 28% from its recent low.
- Resistance sits at $9.50, with support at $8.75–$9.00.
- A break above $9.50 will see the coin move towards $10.00.
On 26 February 2026, Chainlink (LINK) trades at $9.24, down 0.32%, rebounding nearly 28% from its February low near $7.20. The coin is pressing against $9.50 resistance, with support forming at $8.75–$9.00 as bullish momentum strengthens.
Chainlink daily price chart
LINK is trading at $9.24, slightly down on the session, but the structure has improved significantly after the sharp rebound from $7.20. The coin’s price is now testing the upper Bollinger Band near $9.33, reflecting expanding volatility following a squeeze phase. The 20-day SMA at $8.75 has flipped into dynamic support, while the lower band rises toward $8.16, confirming improving trend conditions.
A daily close above $9.50 would mark a clean breakout, and likely shift focus toward the psychological $10.00 level. However, repeated rejection at $9.50 would increase the probability of a pullback toward $8.75, where buyers must defend to maintain bullish structure. The MACD has crossed into positive territory with a strengthening histogram, signaling that upside momentum is accelerating after a prolonged bearish phase. The daily bias remains constructive unless the price loses $8.75 decisively.
Chainlink 4-hour price chart
On the 4-hour timeframe, LINK trades at $9.26, nearly flat (-0.11%), after a sharp impulse move from $8.20 to $9.50, a 15% rally in under two days. The Alligator indicator shows the lips crossing above the teeth and jaw, signaling trend expansion, although price is now consolidating just below short-term resistance.

The RSI stands at 66.85, approaching overbought territory but not yet extreme, which suggests momentum remains strong but vulnerable to short-term cooling. Immediate support sits at $8.90, aligning with the Alligator jaw. Below that, $8.68 becomes the next intraday defense. A break above $9.50 would likely extend toward $9.80–$10.00, while rejection could lead to a controlled retrace back toward $8.90. Momentum remains bullish intraday, but the market is testing overhead supply where profit-taking may increase.
Chainlink technical indicators: levels and action
Daily simple moving average (SMA)
| Period | Value | Action |
|---|---|---|
| SMA 3 | $10.29 | SELL |
| SMA 5 | $9.53 | SELL |
| SMA 10 | $8.99 | BUY |
| SMA 21 | $8.82 | BUY |
| SMA 50 | $10.86 | SELL |
| SMA 100 | $12.13 | SELL |
| SMA 200 | $14.60 | SELL |
Daily exponential moving average (EMA)
| Period | Value | Action |
|---|---|---|
| EMA 3 | $9.51 | SELL |
| EMA 5 | $10.33 | SELL |
| EMA 10 | $11.37 | SELL |
| EMA 21 | $12.10 | SELL |
| EMA 50 | $13.08 | SELL |
| EMA 100 | $14.63 | SELL |
| EMA 200 | $15.97 | SELL |
What to expect from Chainlink?
As long as LINK holds above $8.75–$9.00, bullish pressure remains intact and a breakout above $9.50 becomes increasingly likely. A confirmed daily close above resistance would shift momentum toward $10.00 quickly, but repeated rejection at $9.50 would likely lead to a short-term correction before continuation.
Is Chainlink a good investment?
Chainlink remains a key player in the blockchain ecosystem, with growing demand for its decentralized oracle services and strategic partnerships supporting long-term adoption. While short-term price movements are range-bound, investors may look for a decisive move above $9.09 or a rebound from $8.62 as potential entry points. Moderate selling pressure persists, but the network’s continued utility and real-world applications suggest steady growth potential over time. Traders and investors should carefully monitor key support and resistance levels to make informed decisions and manage risk effectively.
Why is the LINK price down today?
LINK is down 2.29% as of 16 February 2026 due to moderate selling pressure and profit-taking around the $9.09 resistance level. Short-term consolidation and cautious trading sentiment have limited upward momentum, keeping the price range-bound between $8.62 and $9.09. Market participants are waiting for clear directional signals, which contribute to temporary declines despite the network’s ongoing adoption and partnerships.
Will Chainlink reach $50?
Based on long-term forecasts from industry experts, Chainlink (LINK) is projected to reach $50 by 2030.
Will Chainlink reach $100?
Chainlink can reach $100 by 2031. This aligns with real-world asset tokenization according to expert predictions, indicating a potential turning point.
Does Chainlink have a promising long-term future?
Chainlink shows signs of stabilization and potential for recovery, indicating that the token may have a bullish case and promising long-term future within the blockchain industry.
Recent news on Chainlink
NEW: Canton Network adopts Chainlink data and interoperability standards.
- Sergey Nazarov announced his participation in the CFTC’s Innovation Advisory Committee.
Chainlink price prediction February 2026
For February 2026, Chainlink is primed for notable growth, according to the latest link price prediction. The minimum projected trading price is $7.42, with an average of around $8.86 for LINK tokens, relative to the current Chainlink price. LINK is expected to attain a peak price of $10.51.
| Chainlink Price Prediction | Potential Low | Average Price | Potential High |
| February 2026 | $7.42 | $8.86 | $10.51 |
Chainlink (LINK) price prediction 2026
The market price for LINK is expected to reach a maximum of $15.65 in 2026. However, traders can expect a minimum trading price of $9.50, which is influenced by the overall market capitalization and external data sources. The average price of Chainlink is expected to be $13.70.
| Chainlink Price Prediction | Potential Low | Average Price | Potential High |
| Chainlink Price Prediction 2026 | $9.50 | $13.70 | $15.65 |
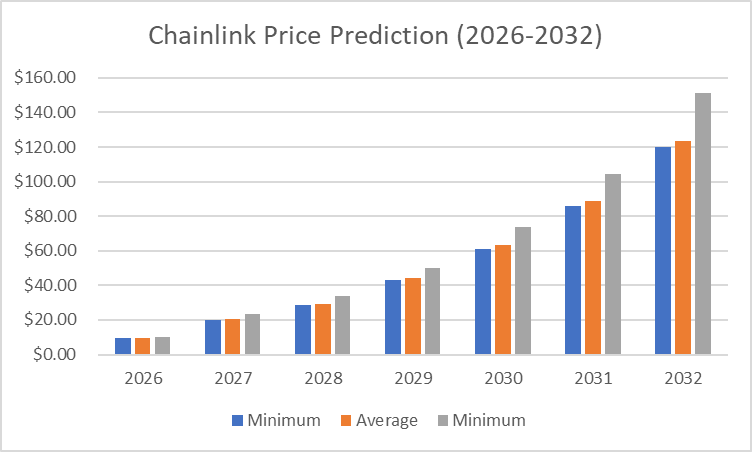
Chainlink price prediction 2027-2032
| Year | Minimum | Average | Maximum |
| 2027 | $19.89 | $20.45 | $23.18 |
| 2028 | $28.60 | $29.42 | $34.09 |
| 2029 | $42.83 | $44.01 | $49.96 |
| 2030 | $61.12 | $63.32 | $73.57 |
| 2031 | $85.95 | $88.48 | $104.58 |
| 2032 | $120.12 | $123.66 | $151.35 |
Chainlink price prediction 2027
In 2027, Chainlink is expected to reach a maximum value of $23.18, a minimum price of $19.89, and an average value of $20.45.
Chainlink price prediction 2028
In 2028, LINK’s average price is expected to be $29.42; its minimum and maximum trading prices, following its historical performance, are predicted to be $28.60 and $34.09, respectively.
Chainlink price prediction 2029
The Chainlink price forecast for 2029 is a high of $49.96. It will reach a minimum price of $42.83 and average at $44.01.
Chainlink price prediction 2030
According to the Chainlink price prediction for 2030, the price of LINK will range from $61.12 to $73.57, with an average price of $63.32.
Chainlink price prediction 2031
In 2031, Chainlink prediction expects LINK to reach a maximum value of $104.58, a minimum price of $85.91, and an average value of $88.48.
Chainlink price prediction 2032
Chainlink prediction climbs even higher into 2032. According to the prediction, LINK’s price will range between $120.12 and $151.35, with an average price of $123.66.
Chainlink market price prediction: Analysts’ LINK price forecast
| Firm Name | 2026 | 2027 |
| CoinCodex | $26.90 | $29.66 |
| DigitalCoinPrice | $8.30 | $11.24 |
Cryptopolitan’s Chainlink price prediction
According to our Chainlink price forecast, the coin’s market price might reach a maximum value of $15.65 by the end of 2026. In 2028, the value of LINK could surge to a maximum cost of $34.09.
Chainlink’s historic price sentiment

Chainlink price history: Coinmarketcap
- Chainlink launched at around $0.20 and remained under $1 throughout 2018, with moderate market cap growth. In 2019, LINK had substantial growth, reaching $1 in May and peaking around $3 by year-end, driven by its utility in providing reliable data feeds for smart contracts.
- 2020 marked a breakout year as LINK surged from $2 to $20 by August, fueled by DeFi demand. In 2021, it reached an all-time high of around $52 in May but dropped to $22 by mid-year due to market volatility.
- In 2022, LINK ranged between $15 and $25 amid broader market corrections. In 2023, it further declined, stabilizing in the $6 to $13 range as investor sentiment cooled.
- Starting 2024 at $15, LINK briefly spiked to $18 in February before falling to $12 by April. The coin’s price has fluctuated throughout 2024, peaking near $15 in May, dropping to around $10 by August, and stabilizing between $10 and $12.28 in October. In November, LINK is trading within the range of $10.68 to $11.94. In December, LINK maintained a range of $18.43 to $30.94.
- In January 2025, Chainlink peaked at $22.90 but lost momentum towards the end of the month, leading to a trading range of $19.20-$21.00 in February.
- In March 2025, Chainlink (LINK) experienced a strong upward trend, starting at approximately $13.73 and steadily rising to $16.02, with periods of volatility.
- In April, Chainlink (LINK) showed relatively stable price movement, fluctuating between $10.7 and $15.3, indicating volatility within a broad trading range.
- In May, Chainlink (LINK) began trading at approximately $14.20 and experienced some price fluctuations, dipping to a low of $13.90. According to the latest data, the price has slightly recovered and is currently around $14.06, exhibiting mild volatility.
- Chainlink (LINK) fluctuated between $11.50 and $15, experiencing a sharp mid-June dip but essentially stabilizing around $13.10 by early July.
- In August, Chainlink (LINK) traded in the price range of approximately $15.8 to $16.6, with its latest price reaching $16.6 on August 4th.
- The Chainlink (LINK) price ranged between a high of $23.19 and a low of around $22.20, currently trading at $22.71 as of September 2025.
- In October 2025, Chainlink traded around $22.6, showing strong recovery momentum compared to its earlier lows in previous years.
- Chainlink traded within a tight range between $13.75 and $15.25 from November 4 to 5, 2025, ultimately closing at $14.67 after a volatile 24-hour session.
- As of January 2026, Chainlink (LINK) traded between roughly $13.6 and $14.2, showing intraday volatility but ending the period near $14.16 after a late rebound.
- As of February 2026, the coin is trading between $7.40 and $9.97.